Notes from the workbench.
Technology leadership, data readiness, applied AI, and production software notes from the people doing the work.
No trend-chasing. No innovation theater. Just the messy middle between technical ambition and systems that actually run.
21 posts

What Disconnected Systems Actually Cost You Every Month
Integration debt is the cost accumulated between systems when decisions are made without enough information, made rapidly when pacing is more important, or when constraints force your hand. It isn’t in itself a bad thing, but it is limiting. Here's how to measure it and begin paying it down.

The Only Person on Stage Who Makes No Sound
We built Made In Tandem around one stubborn idea and held onto it for fifteen years. Then AI showed up, and for a while I was certain it had made that idea worthless. Boy did I have it backwards.

Made in Tandem Honored as Gold Stevie Award Winner in 2024 American Business Awards
Made in Tandem has earned the Gold Stevie Award in Professional Services at the 2024 American Business Awards. Tandem's work modernizing SDG&E's Emergency Notification System reduced a 37-step process to just ten steps, improving public safety response times.

Revolutionizing Business Operations with Future-Fit Software
Future-fit software puts customer needs at the center and enables organizations to adapt quickly as technology and markets evolve. This post explores how embracing modern application development, Agile, and DevOps creates the foundation for resilient, future-ready businesses.

Tandem Named a 2023-2024 Cloud Award Winner
Tandem has been named a winner in the 2023-2024 Cloud Awards for Best Cloud Migration or Systems Integration Solution. The award highlights Tandem's work modernizing MIRS, the military enlistment tracking system, with an AWS GovCloud migration.
Evaluating a Microservice Architecture
Microservice architecture promises scalability and adaptability, but it comes with real trade-offs in complexity and latency. This post weighs the pros and cons to help teams make informed decisions about whether microservices are right for their systems.

Breaking Down Data Silos: Unleashing Your Company's Hidden Data Potential
Data silos silently stifle growth, keeping valuable insights locked away from the teams who need them most. This post shows how to identify the warning signs of siloed data and move toward a Data-as-a-Product approach that breaks down barriers across your organization.

Choosing Between Contractors and Consultants: What’s the Best Decision?
Contractors execute well-defined tasks on short timeframes, while consultants bring strategic guidance and big-picture thinking to complex problems. This post breaks down the key differences to help you decide which type of software professional is right for your next project.
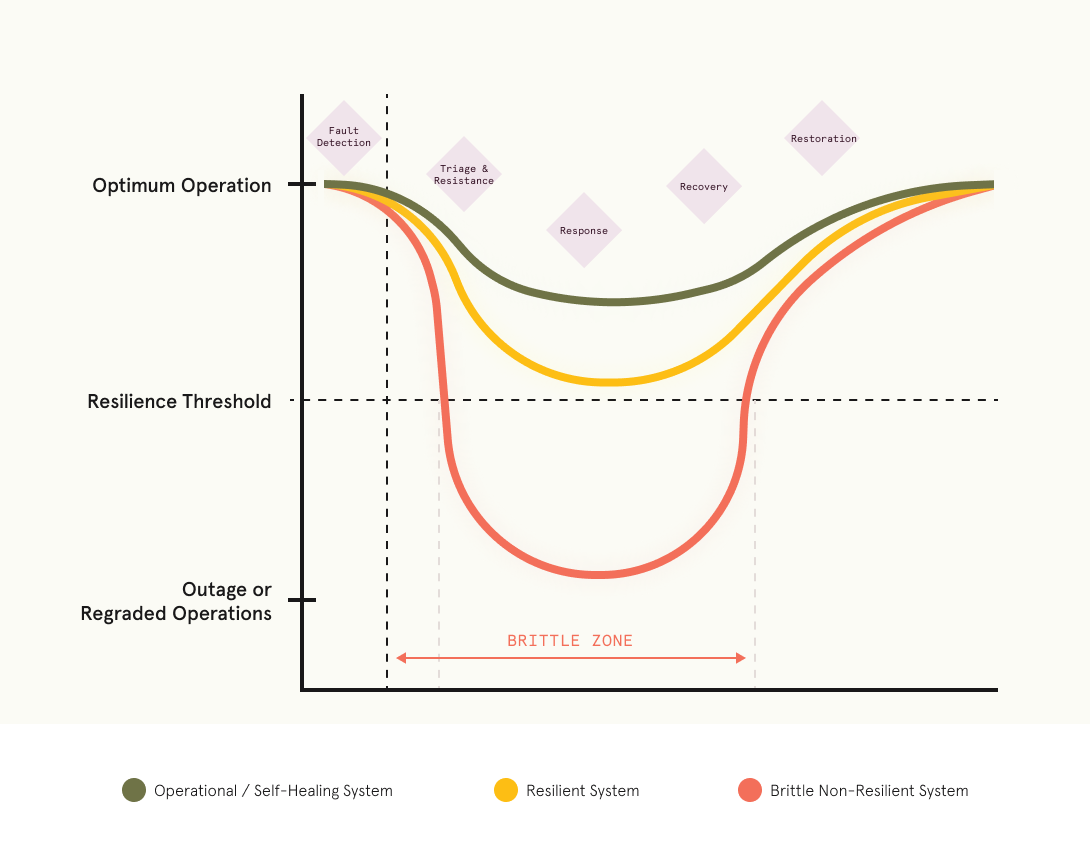
Becoming a More Resilient Software and Technology Organization
Software resilience isn't just about uptime - it's about culture, metrics, and preparedness. This post lays out a practical framework for building organizations that can detect, respond to, and recover from disruptions before they become disasters.

Tandem Roundtable: Microservices Vs. Monolithic Architecture
Four Tandem engineers square off on one of software's great debates: microservices vs. monolithic architecture. They cover the real trade-offs in scalability, complexity, team communication, and when each approach actually makes sense.

Tandem Honored as Gold Stevie Award Winner in 2023 American Business Awards
Tandem has won Gold Stevie Awards in two categories at the 2023 American Business Awards, honoring the modernization of the DoD's MIRS application. The project replaced a 25-year-old enlistment tracking system with a streamlined platform that helps field advisors process recruits faster than ever.

Planning a Successful Data Migration
A data migration is more than a technical lift - it requires careful stakeholder alignment, a deep understanding of your data, and a thorough test plan. This post covers universal planning strategies to help teams navigate the complexities of any migration project.

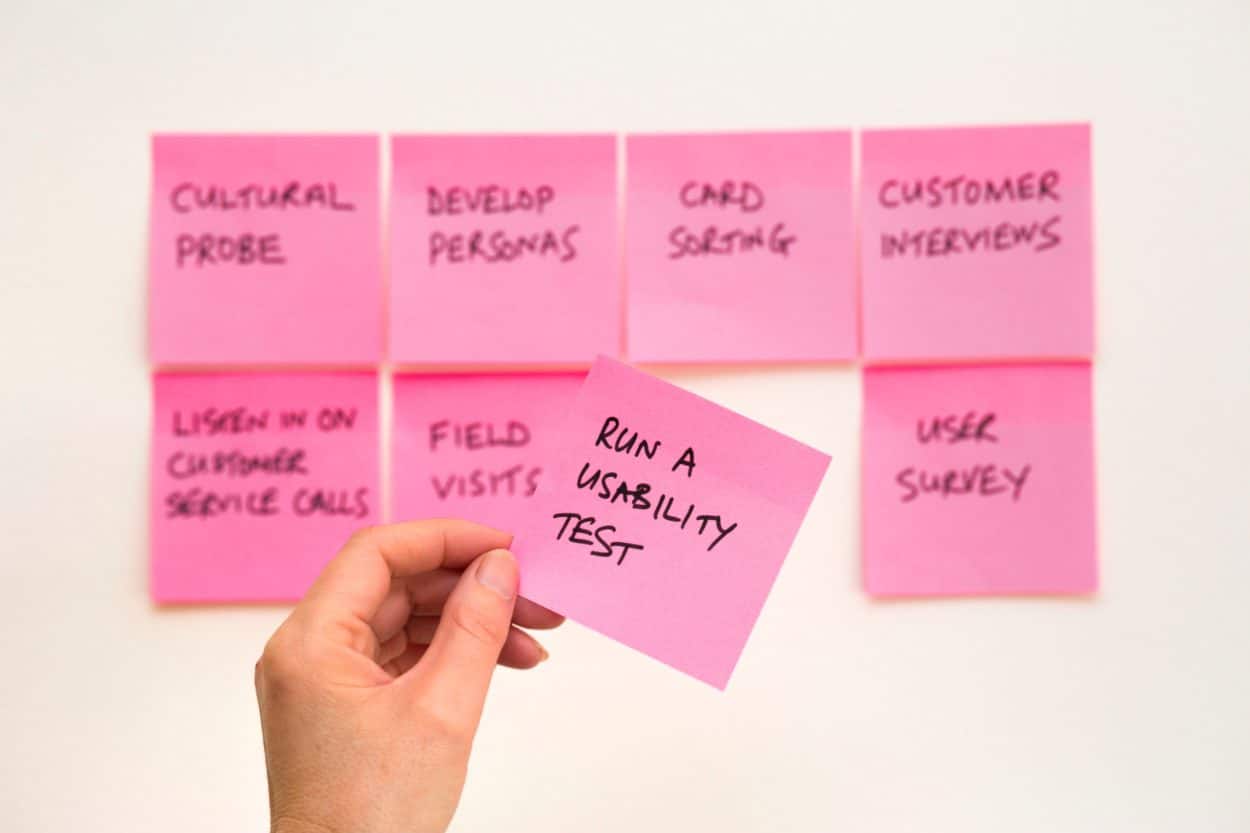
Human-Centered Agile: Part 1
Agile and human-centered design aren't competing methodologies - they're complementary philosophies. Part 1 of this series explores how combining them addresses the blind spots of each, leading to products that are both well-built and genuinely useful.

When is the Right Time to Pay Down Tech Debt?
Technical debt is unavoidable, but how you manage it makes all the difference. This post offers a practical framework for knowing when to pay it down immediately, tackle the highest-interest areas first, or chip away at it consistently over time.

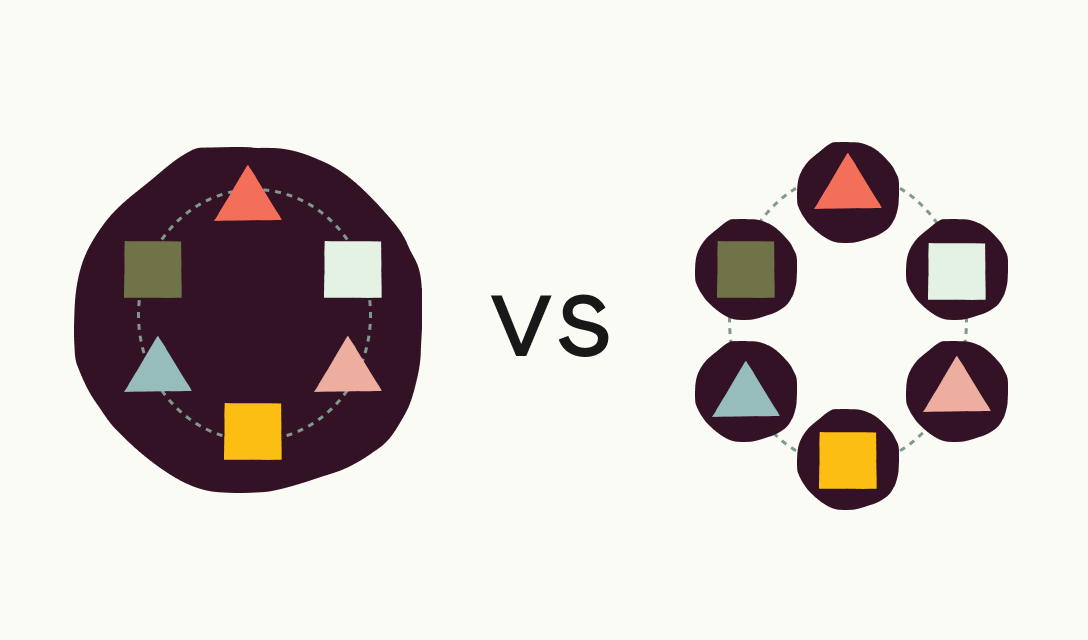
Designing for Complex Systems
Designing for enterprise systems with many integrations and diverse users requires more than a polished UI. This post explores how deep user research, stakeholder collaboration, and understanding of system architecture lead to experiences that make complexity invisible.

The Massive Hertz-Accenture Lawsuit Should Be A Warning To Everyone In Consulting. Here’s What We Can Learn From It
When Hertz sued Accenture for $32M over a failed website redesign, the story became a lesson in what goes wrong when consulting projects lack clear requirements and realistic timelines. Tandem CEO JC Grubbs breaks down what likely went wrong - and how they'd do it differently.

Assessing Your Digital Transformation Readiness
Digital transformation isn't just a technology initiative - it's a fundamental shift in how an organization operates and delivers value. This post offers a readiness questionnaire to help leaders honestly assess whether their organization is prepared for the journey.

Are Technical Debt and Legacy Systems Affecting Your Digital Transformation?
Legacy systems and technical debt are unavoidable in any growing enterprise - but left unmanaged, they can quietly strangle agility and competitiveness. This post helps leaders assess where they stand and outlines concrete strategies for modernizing without shutting down the core business.
Human Centered Agile: Part 3
The final installment in Tandem's Human-Centered Agile series maps out a full process from research through construction - including how to connect strategic user insights to tactical product decisions and when to bring in user testing to stay on track.
Human Centered Agile: Part 2
Part 2 of Tandem's Human-Centered Agile series explores where the philosophies can falter - from the myth of the MVP to the revenge of waterfall - and lays out the core principles that make design and development teams genuinely stronger together.
Meeting Customers Where They Are
Great consulting isn't about prescribing solutions - it's about understanding people and organizations as they are right now. This post explores Tandem's approach to empathizing with clients, countering imbalances, and earning trust before pushing toward change.
Want the field notes applied to your system?
If your platform, data, or AI work is stuck between strategy and production, bring us the messy version. That is usually where the useful work starts.