The platform behind some of the largest corporate restructurings in the world.
When a Fortune 500 company decides to reorganize, the consulting engagement that follows is a quiet exercise in arithmetic. Every box on every proposed org chart implies a salary, a span of control, a reporting line, and a workload allocation. Move one box and a dozen other boxes need to move with it. Get the math wrong and the savings the client signed up for evaporate, or the new structure collapses under its own weight three months after launch.
BCG's restructuring practice has been running engagements like this for decades. The work itself isn't new. What had become unmanageable was the tooling. Spreadsheets, even good ones, struggle when you're modeling thirty thousand employees across half a dozen scenarios while a client team and a BCG team both need to edit the same data without stepping on each other. Every senior consultant we talked to had the same complaint: most of the engagement's risk lived in the formulas, not the recommendation.
OrgBuilder is the answer we built with them. HRIS data flows in from whatever system the client uses. Consultants and client stakeholders work the same canonical model under different permissions. Scenarios fork, mutate, and get scored against the constraints that matter. Reports come out the back end ready to defend in a steering committee. The math becomes the boring part of the job, which is exactly what BCG wanted.
Org design is a four-variable optimization. Spreadsheets only let you see one variable at a time.
Every restructuring engagement BCG runs lives at the intersection of four constraints that trade off against each other. Reduce cost too aggressively and your spans of control explode. Flatten the layers and you push too much workload onto the remaining managers. Tighten spans and you grow the cost line. Balance all four well and you have a recommendation. Balance any one of them poorly and the entire plan unravels in implementation.
The honest version of how this used to work: BCG consultants would pull a payroll export from the client's HRIS, paste it into Excel, build out a current-state org chart through nested IF statements and a wall of VLOOKUPs, and then start modeling. Scenario A: 12% cost reduction with current spans intact. Scenario B: target spans of 7-to-10 with a layer collapsed. Scenario C: workload-balanced version of B. Each scenario meant duplicating a thousand-row sheet, hand-editing reporting relationships, and praying that the formulas didn't break in a way that wasn't immediately visible.
Excel has a particular failure mode in this kind of work. The spreadsheet usually keeps calculating something. It just isn't always calculating the right thing. A senior consultant once told us the most expensive moment of an engagement was the morning someone discovered the projected savings figure had been double-counting an entire sub-org for two weeks of model iteration. By that point the client had seen the number. That kind of error is what happens when complex hierarchical data lives in tabular tooling.
There was a collaboration problem on top of the math problem. A client's HR team needed to see and edit some of the data, but not all of it. BCG's analysts needed full edit rights on the modeling layer but had to be careful not to overwrite ground-truth records. Sub-teams running parallel scenario branches needed isolation from each other until it was time to merge. None of that maps cleanly to a shared spreadsheet, and yet shared spreadsheets were the default.
A canonical model. Forkable scenarios. A scorecard that makes the trade-offs visible.
The technical question driving the design wasn't "how do we make a better spreadsheet." It was "how do we represent an organization in software so that consultants can ask any question about it and get a defensible answer in seconds." Four design decisions came out of that framing, and each one had to hold up under the conditions of a live BCG engagement.
HRIS ingestion that meets the client where they are
Every BCG engagement starts with the client's HRIS export, and every HRIS exports data slightly differently. Workday, SAP SuccessFactors, Oracle HCM, ADP, and the long tail of in-house systems each have their own column conventions, hierarchy representations, and assumptions about what an "employee" record actually contains. We built ingestion adapters that normalize all of it into a single canonical model: people, positions, reporting relationships, compensation, and the metadata needed to score scenarios against the four constraints.
The adapters do more than column mapping. They handle dotted-line relationships, contractor records, vacant positions, and the dozens of edge cases that don't fit a clean parent-pointer hierarchy. When the input data is ambiguous, OrgBuilder surfaces the ambiguity to the consultant rather than guessing. That's the difference between a tool consultants trust and a tool that quietly produces wrong answers.
Scenarios as first-class objects
A scenario in OrgBuilder is a forked copy of the canonical org graph. Consultants can spin up a scenario in seconds, mutate it freely (move people, eliminate positions, collapse a layer, restructure a function), and compare it against the baseline or against any other scenario. The system tracks every change as a structured edit, so a "Scenario C" is never a soft copy that drifted from "Scenario B"; it's a deterministic delta from the source of truth, replayable and explainable.
That structure changes how teams work. Two analysts running parallel scenario branches don't conflict because each branch is isolated. When one branch's logic deserves to win, its edits get merged into the active scenario the same way a well-run team merges code. Scenarios that don't pan out get archived, not deleted, so the engagement memory stays intact.
A constraint engine that scores every move
The four constraints, cost, span of control, reporting depth, and workload, are evaluated continuously as the consultant edits the scenario. Move someone and the totals at the top of the workspace update. Push a span outside the engagement's policy bounds and the affected role gets flagged. Drop a layer and the system shows you which managers absorbed the orphaned reports. The math that used to live in fragile formulas now lives in a deterministic engine that can't disagree with itself.
Each engagement configures its own thresholds. A retail client's span policy is different from an investment bank's. A cost-takeout mandate is different from a growth-driven restructure. The engine is parameterized so a BCG team can encode the engagement's specific policy at the start, and every scenario afterwards gets scored against those parameters automatically.
A workspace where consultants and clients actually share data safely
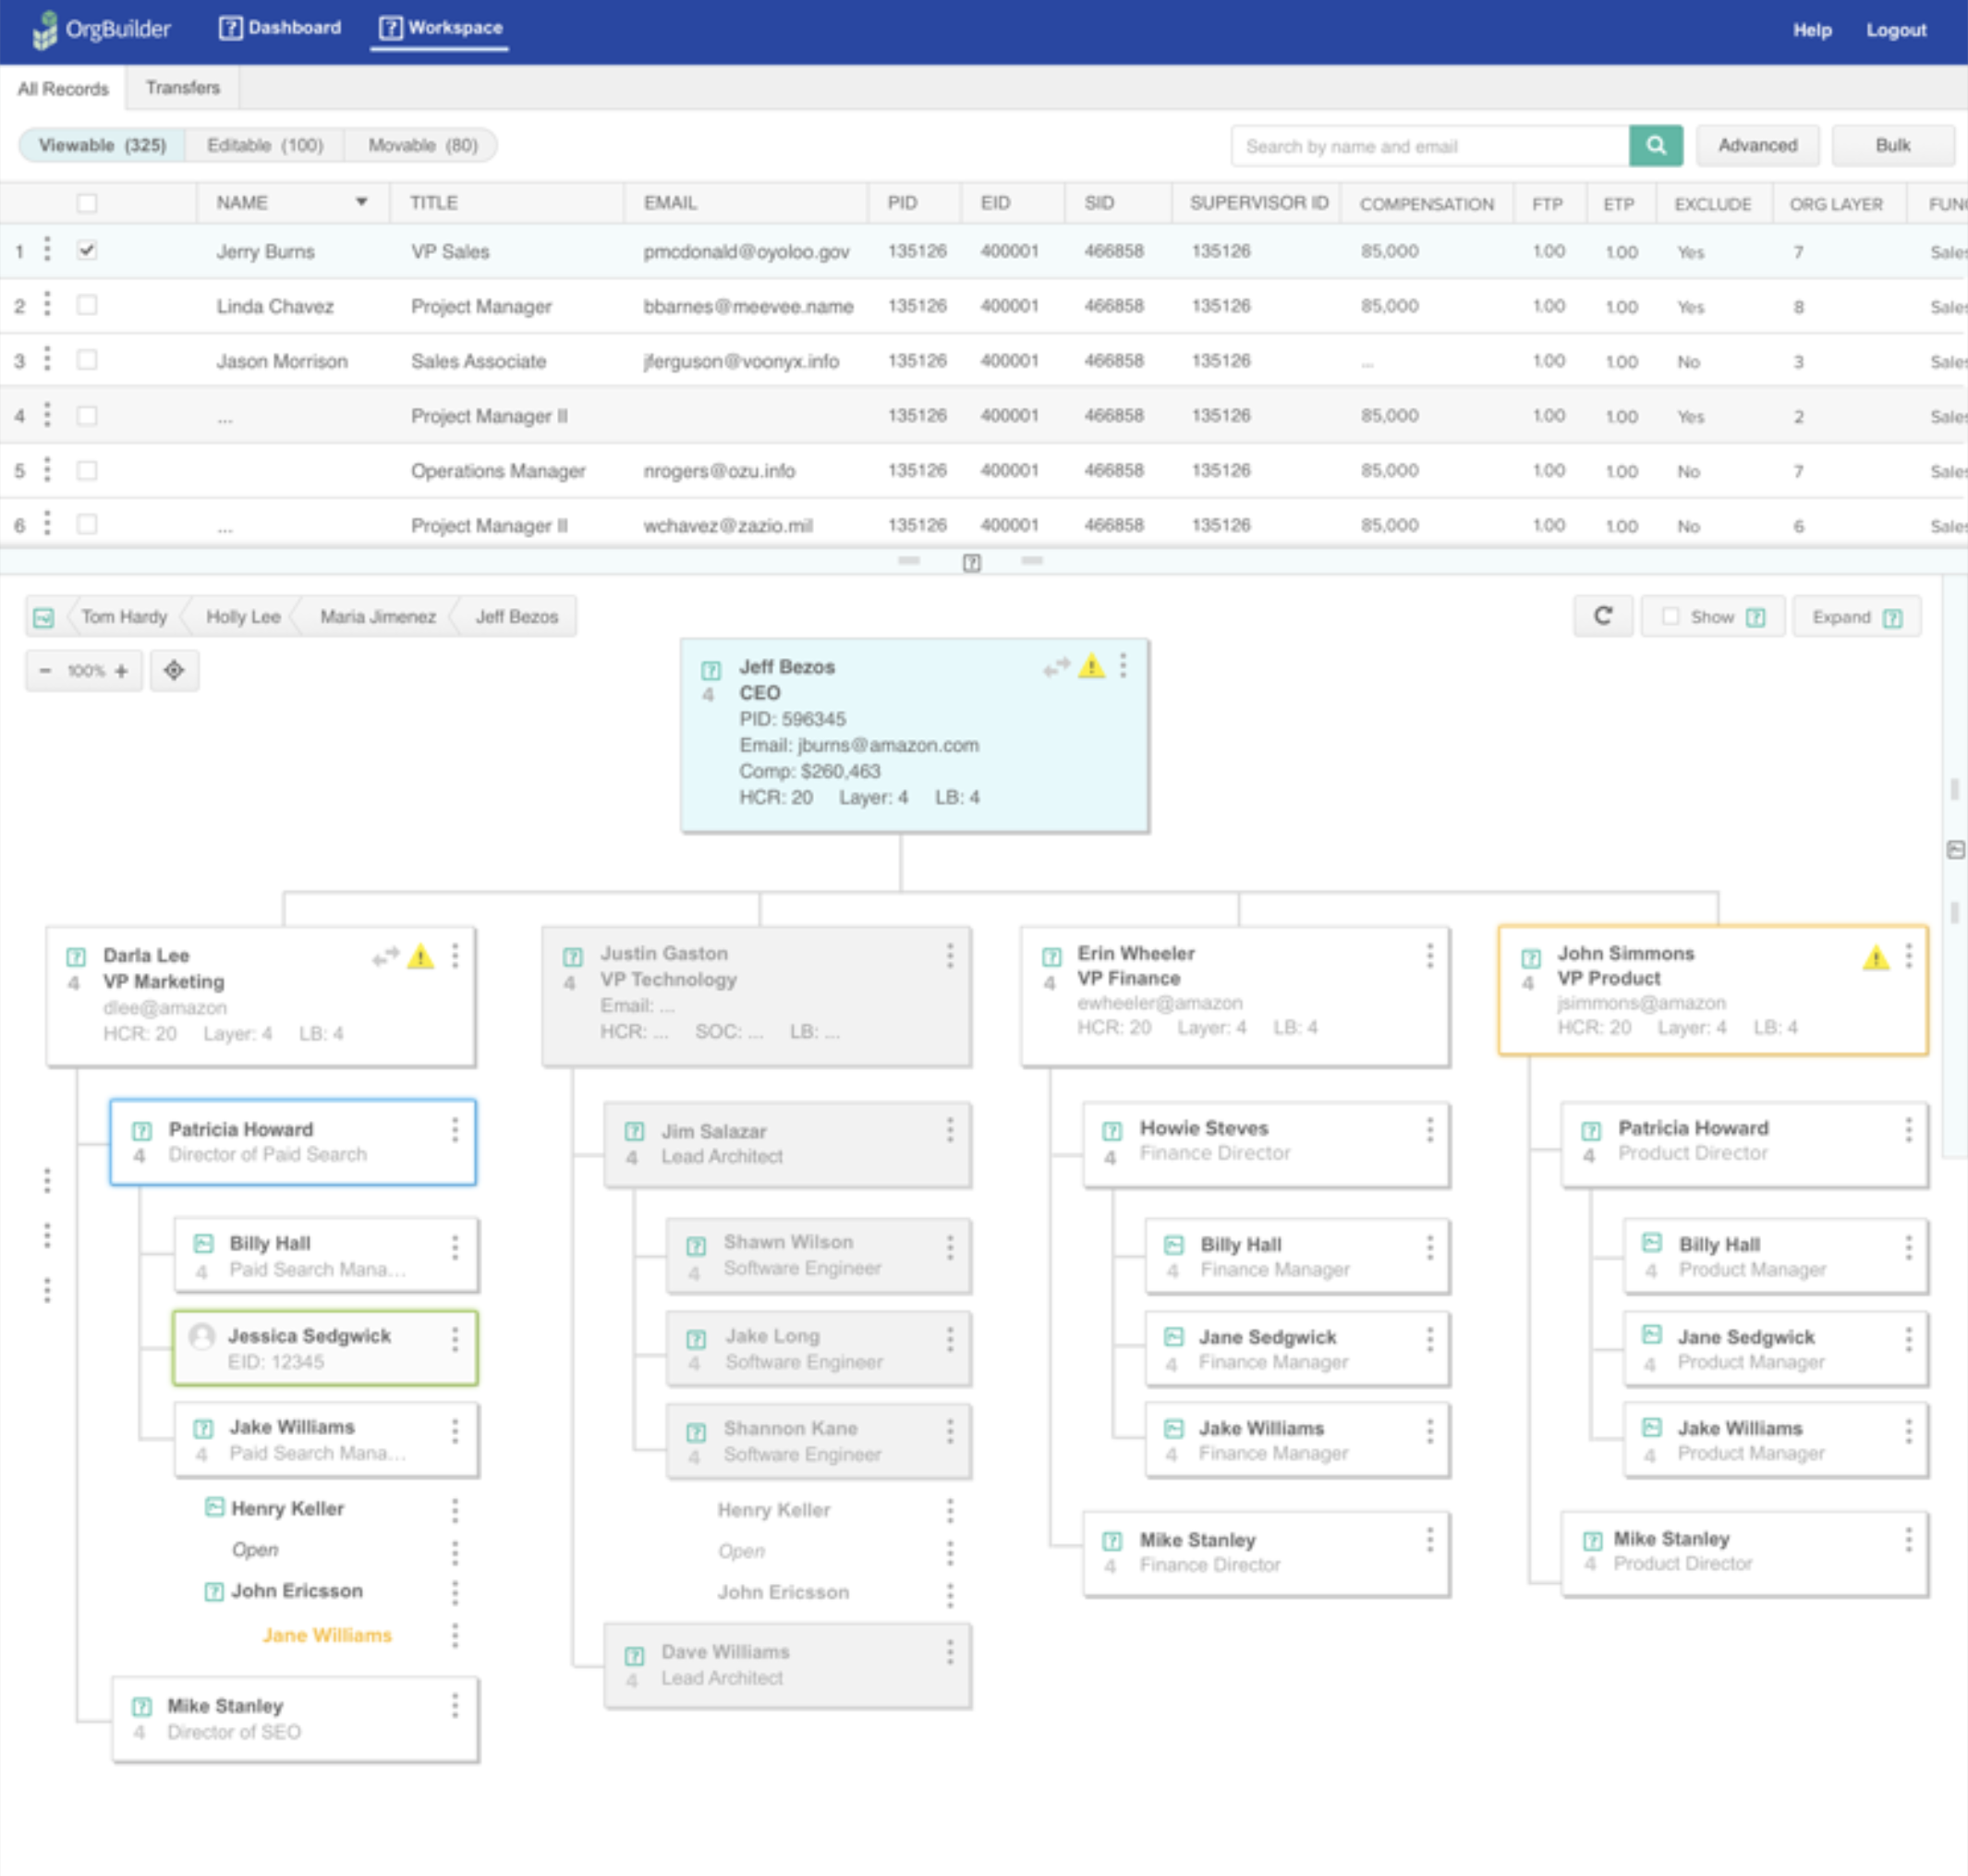
The screenshot at the top of this page hints at it: every record has a permission state. Some records are viewable, fewer are editable, fewer still are movable. The workspace enforces those boundaries automatically based on who's logged in and which engagement role they hold. A client HR partner sees what they need to see and can edit what they're authorized to edit. A BCG analyst running scenarios can move people across the modeling layer without altering the ground-truth records the client cares about.
That permission model is the difference between OrgBuilder being a tool BCG can use across engagements and a tool BCG would have had to keep in a closed environment. Sensitive payroll data, real names, real reporting relationships, all of it stays governed without slowing down the work.
OrgBuilder platform architecture
HRIS data on the left, the consultant's workspace on the right, and in between: a canonical org model that scenarios fork from, a constraint engine that scores every edit, and a reporting layer that turns the final scenario into something a steering committee can defend.
A workspace consultants can run an entire restructuring out of.
OrgBuilder is a single workspace with two main views and one engine doing the math underneath. The records view shows the people. The org chart shows the structure. The constraint scorecard shows whether the current scenario meets the engagement's policy. Edit anything in one view and the others update.
Records and chart, two windows on the same model
The top of the workspace is a tabular view of every employee record in the active scenario, filterable by name, by function, by org layer, by viewable, editable, or movable status, and by anything else worth indexing. The bottom is the live org chart, with the same selection state and the same edit affordances. Drag a card in the chart and the row in the table updates. Edit a cell in the table and the chart redraws. There's no concept of "the chart is out of date with the data," because the chart is the data.
Warning indicators that surface real risk, not noise
Every card in the org chart can show a warning indicator when one of the engagement's constraints is violated for that role. Span over policy. Compensation outside band. Layer count past target. Workload imbalance. The icons are small but consistent, and a click on any of them opens a panel that explains the violation and shows what would resolve it. Consultants stop hunting for problems and start solving them.
Transfers as a first-class workflow
Restructuring routinely involves moving people between functions, and we treated that as a workflow rather than a side effect of editing reporting lines. The Transfers tab tracks every proposed move, who initiated it, what the receiving manager's span looks like before and after, and the cumulative cost impact. It's the audit trail BCG hands the client when the recommendation gets adopted, and it's the running checklist while the recommendation gets built.
Reports the steering committee can defend
When a scenario is ready to present, OrgBuilder generates the artifacts BCG actually walks into the meeting with: scenario summary slides, side-by-side comparisons, before-and-after spans, function-level cost deltas, and the structured export the client's HRIS team will use to load the new structure back into Workday or SAP when the plan is approved. The reporting layer is the deliverable, not an afterthought.
The math became the boring part of the engagement. The recommendation got harder to argue with.
OrgBuilder shipped to BCG's restructuring practice and now runs underneath engagements at companies most people would recognize. The numbers below are the durable structural ones; the per-engagement savings are confidential and substantial.
The most visible change is in how a typical engagement runs. The first week of an OrgBuilder-supported engagement looks different from the first week of a spreadsheet-supported one. Data ingestion that used to consume an analyst for days happens in hours. Scenario A through D get stood up in the time it used to take to produce Scenario A. The conversations between BCG and the client shift sooner from "what's the model saying" to "what should we do about what the model is saying," which is where the conversation should have been the whole time.
The less visible change is in what gets caught. Errors that used to slip through to a steering committee deck now get flagged the moment a span goes out of policy or a layer count exceeds target. The model can be wrong in lots of ways, and it can still be wrong, but it can't be quietly wrong, which is the failure mode that ends consulting engagements badly. The constraint engine simply won't let the math drift.
And the platform compounds across the practice. Every engagement that runs through OrgBuilder leaves behind a structured, replayable record of how the restructuring was modeled and why each decision was made. That's institutional memory the firm didn't have when the artifact of the work was a folder full of spreadsheets named "v3_FINAL_FINAL_use_this_one.xlsx."